How Our Monitoring Stations Work, Data Sources, Science and How to Read the Dashboard
AQUA-SMART Science Team, e-AQUAF Project (BSB01009)
What Is AQUA-SMART?
AQUA-SMART is the environmental observatory built within the e-AQUAF project, Smart Aqua Farming, co-funded by the Interreg NEXT Black Sea Basin Programme of the European Union. It brings together real-time in-situ sensors, daily satellite imagery from NASA and the European Copernicus programme, and artificial intelligence to give aquaculture operators, researchers and policymakers a live picture of Black Sea water quality conditions.
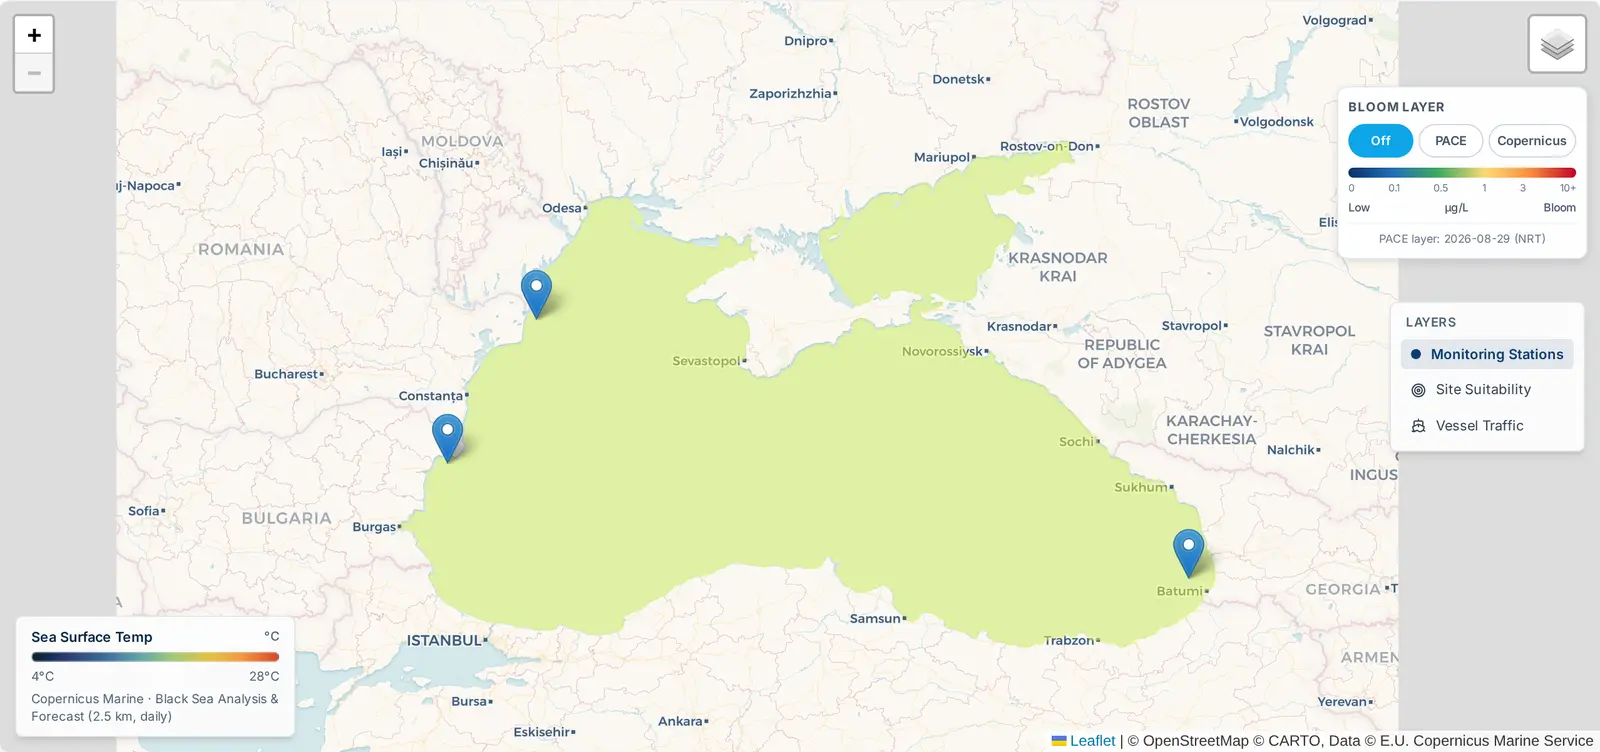
The platform currently monitors three stations across the Black Sea basin:
- Romania, Danube Delta, Sulina (45.1567° N, 29.6547° E)
- Bulgaria, Black Sea Coast, Varna (43.2141° N, 27.9147° E)
- Georgia, Batumi Coast (41.6168° N, 41.6367° E)
Each station feeds data into a unified dashboard available at www.eaquaf.eu/monitoring-stations. This article explains every data source, every chart, and the science behind the numbers, including the new features added in the June 2026 platform update.
The Three Data Sources
The platform fuses three independent data streams. Each covers a different aspect of the water column and has different spatial and temporal resolution.
1. IoT In-Situ Sensors
Each physical monitoring buoy carries a sensor array measuring parameters directly in the water at the farm site:
| Parameter | Unit | Sensor update rate |
|---|---|---|
| Dissolved Oxygen (DO) | mg/L | Hourly |
| pH | , | Hourly |
| Sea Surface Temperature (SST) | °C | Hourly |
| Salinity | PSU | Hourly |
| Turbidity | NTU | Hourly |
| Conductivity | mS/cm | Hourly |
| TDS | ppm | Hourly |
These readings are transmitted via 4G LTE or LoRa radio to the AQUA-SMART backend and stored in a time-series database. The buoys are solar-powered with internal battery backup. Romania transmits via LoRa; Bulgaria and Georgia via 4G LTE.
2. Copernicus Marine Service (CMEMS)
The European Commission's Copernicus Marine Environment Monitoring Service provides operational ocean forecasts and analyses for the Black Sea at 2.5 km spatial resolution and daily temporal resolution. AQUA-SMART pulls the following Copernicus products:
| Parameter | Copernicus Product | Resolution |
|---|---|---|
| Sea Surface Temperature | BLACK_SEA_PHY_ANALYSIS_FC_007_001 | 2.5 km, daily |
| Sea Surface Height (SSH) | BLACK_SEA_PHY_ANALYSIS_FC_007_001 | 2.5 km, daily |
| Significant Wave Height (Hs) | BLKSEA_MULTIYEAR_WAV_007_006 | 2.5 km, daily |
| Current speed U/V | BLACK_SEA_PHY_ANALYSIS_FC_007_001 | 2.5 km, daily |
| Chlorophyll-a (NRT) | OCEANCOLOUR_BLK_BGC_L4_NRT_009_153 | 1 km, daily |
| Nitrate | BLACK_SEA_BGC_ANALYSIS_FORECAST_007_010 | 2.5 km, daily |
| Dissolved Oxygen (satellite) | BLACK_SEA_BGC_ANALYSIS_FORECAST_007_010 | 2.5 km, daily |
The Copernicus NRT products carry a rolling archive of approximately 14 days. The Sea Surface Height anomaly layer is particularly important for detecting mesoscale eddies, rotating water bodies 50–200 km in diameter that bring nutrient-rich deep water to the surface. When SSH exceeds +20 cm, AQUA-SMART triggers an Eddy Alert and advises monitoring for a bloom response 7–14 days later (Oguz & Gilbert, 2007).
3. NASA PACE OCI Satellite
NASA's PACE (Plankton, Aerosol, Cloud, ocean Ecosystem) satellite, launched February 2024, is the most scientifically advanced ocean colour satellite ever deployed. Its Ocean Color Instrument (OCI) operates across 286 spectral channels at 1 km resolution daily. AQUA-SMART uses two PACE products:
Chlorophyll-a (L3m daily): retrieved via NASA OPeNDAP in both Science Quality and Near Real-Time collections with a 4-candidate URL fallback. Validated by the PACE Postlaunch Airborne Experiment (PACE-PAX, September 2024).
Phytoplankton Community Composition: PACE's hyperspectral capability distinguishes four functional types from spectral absorption shape, a capability unavailable in MODIS, Sentinel-3 or any previous satellite:
| Phytoplankton type | Aquaculture significance |
|---|---|
| Diatoms (490 nm) | Most beneficial bloom type; high-quality food, no toxins |
| Dinoflagellates (555 nm) | Moderate risk; some species produce shellfish toxins |
| Cyanobacteria (670 nm) | High risk; associated with fish kills and oxygen crashes |
| Haptophytes | Generally low risk |
Reading the Dashboard
When you open any station page, you see a Mortality Risk banner, seven data sections, and a Compare panel. The basin-wide map now lives on its own full-screen page, the Atlas at www.eaquaf.eu/atlas, while the Monitoring Stations page shows a compact map preview card that links to it. Here is what each one shows and how to interpret it.
Header, WQI, Bloom Risk and New Indicators
The page opens with four items that require immediate attention before any chart:
| Item | What it shows |
|---|---|
| WQI badge | Water Quality Index 0–100. Weighted composite: DO 35%, pH 25%, SST 25%, Salinity 15%. Below 40 = emergency; 40–60 = monitor closely; above 75 = optimal. |
| Bloom risk % | Percentage of the last 30 days where Chl-a exceeded 3.0 µg/L. Above 70% means most of the recent month was at or near bloom conditions. |
| CSV button | Downloads the last 90 days of raw sensor readings as a spreadsheet. |
| Certificate button | NEW, Generates a downloadable PDF certificate documenting satellite-verified environmental conditions for the last 90 days. Suitable for regulatory submissions, premium product labelling, and EU project reporting. References NASA PACE OCI, Copernicus Marine NRT, IoT in-situ sensors and the PACE-PAX validation. |
Mortality Risk Index and Daily Feeding Guide (NEW)
Directly below the header badges, a full-width banner computes a real-time Mortality Risk level from four signals:
| Signal | How it scores |
|---|---|
| Signal 1: WQI trend | Last 6h vs previous 6h. Weight 1 if declining >5 points; weight 2 if falling rapidly >10 points. |
| Signal 2: Bloom status | Weight 1 if Chl-a > 3.0 µg/L (bloom threshold); weight 2 if Chl-a > 5.0 µg/L (active bloom). |
| Signal 3: DO trajectory | Weight 3 if DO < 6.0 mg/L (hypoxia); weight 2 if DO > 11.5 mg/L (supersaturation); weight 1 if DO trend negative. |
| Signal 4: SST anomaly | Weight 1 if SST > 3°C above seasonal baseline. |
Total weight determines the banner level: LOW (stable), ELEVATED (one or two minor signals, monitor closely), HIGH (multiple signals, reduce feeding, inspect aeration), CRITICAL (severe combination, stop feeding, activate emergency aeration, contact site manager).
A 60-pixel WQI sparkline below the level shows the projected WQI over the next 48 hours. The banner updates on every auto-refresh (every 5 minutes). Expanding the banner reveals the Daily Feeding Guide, recommended daily ration as a percentage of normal, optimal feeding timing window, and the specific rules driving any reduction (e.g. 'DO supersaturated, reduce to 40% ration, stop feeding by 13:00'). Sources: Boyd (2015); Beveridge (2004).
Section 1, Water Temperature & Stratification
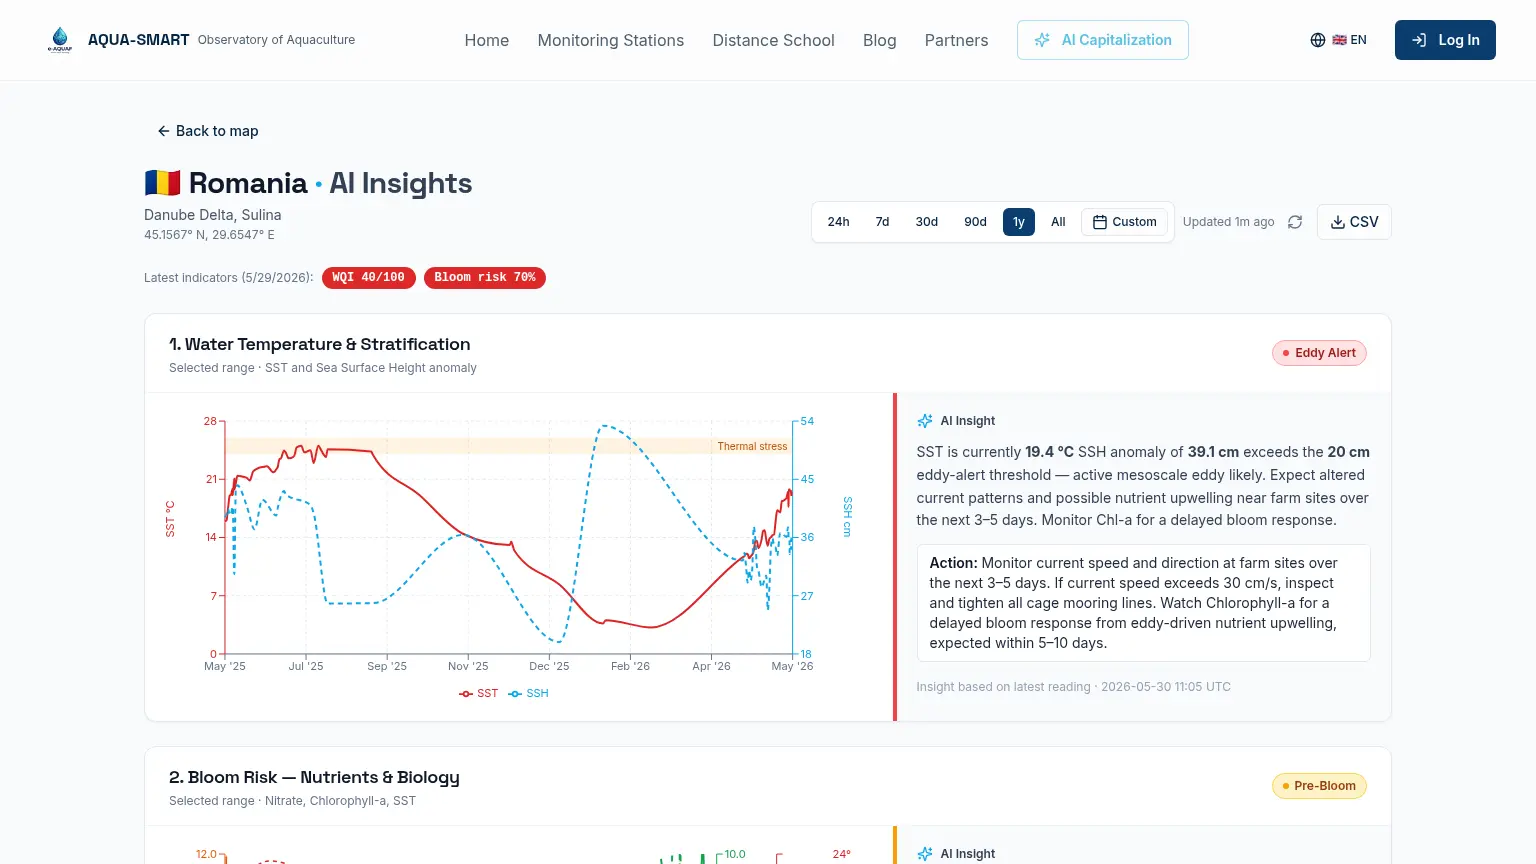
SST (red line, left axis) and SSH anomaly (blue dashed line, right axis) over the selected time range.
SST drives fish metabolism, each species has an optimal range outside which feeding rates drop, disease risk rises and in extreme cases mortality occurs. The red dashed Thermal Stress line marks the upper safe temperature threshold.
The SSH anomaly represents deviation of the sea surface from its long-term mean. Positive anomalies indicate an anticyclonic eddy. When SSH exceeds +20 cm, the Eddy Alert badge activates. Eddies alter current patterns, can drive nutrient upwelling, and often precede bloom events by 1–2 weeks (Oguz & Gilbert, 2007).
What to watch for: A rapid SST increase of 3°C above the seasonal baseline combined with an active Eddy Alert is the strongest predictor of a bloom event within the next 7–14 days.
Section 2, Bloom Risk, Nutrients & Biology
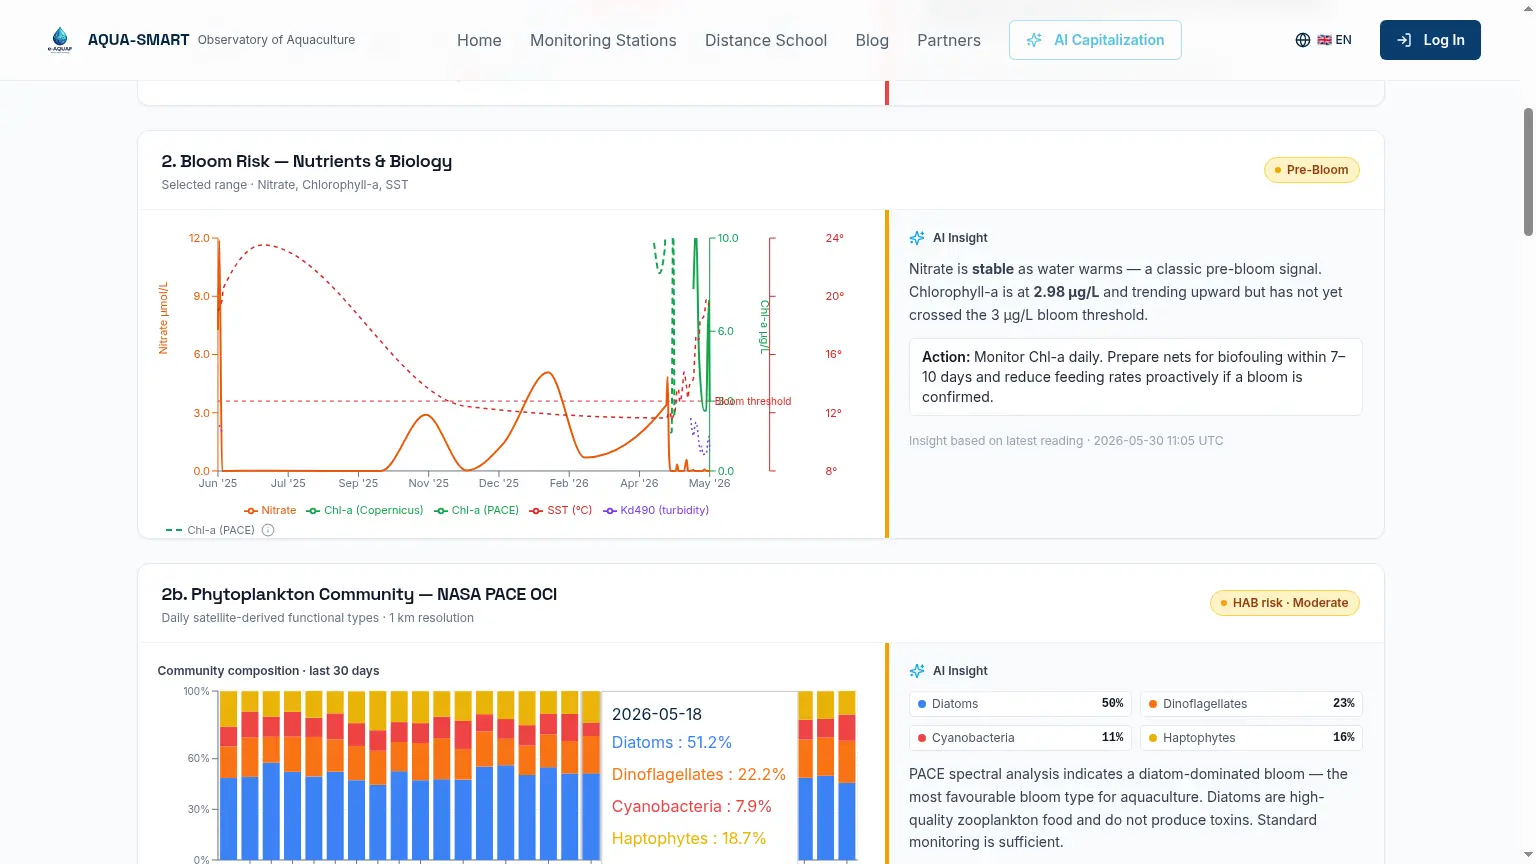
Five overlays on a shared time axis: Nitrate (µmol/L), Chl-a from Copernicus NRT (µg/L), Chl-a from NASA PACE (µg/L), SST (°C) and Kd490 (light attenuation / turbidity proxy).
The green dashed Bloom Threshold line is set at 3.0 µg/L, consistent with Black Sea eutrophication guidelines (Black Sea Commission, 2019) and Black Sea bloom dynamics literature (Oguz & Gilbert, 2007).
Having two independent chlorophyll sources (Copernicus and PACE) on the same chart allows cross-validation. If both rise together on the same day, bloom confidence is high. If only one shows it, the other may be affected by cloud contamination or retrieval artefact.
Example reading (Romania, 30 May 2026): Nitrate declining as water warms, a classic pre-bloom signal. Chl-a at 2.98 µg/L trending upward but not yet at the 3.0 µg/L threshold. Platform classification: Pre-Bloom.
Section 2b, Eddy–Bloom Correlation Timeline (NEW)
Placed directly below the main bloom chart, this section shows the full history of SSH anomaly (blue line) versus Chl-a (green area) on a shared time axis.
- Vertical grey bands mark eddy events (SSH > 20 cm for 3+ consecutive days)
- Vertical green bands mark bloom events (Chl-a > 3 µg/L for 3+ consecutive days)
- Curved arrows with '+N days' labels connect eddy peaks to bloom onsets when the lag is 7–21 days
The AI insight below reports the number of eddy–bloom pairs observed in the last 12 months, the correlation percentage, and the average lag. If correlation ≥ 50%, a Bloom Watch activates automatically whenever an Eddy Alert fires, giving farmers 7–21 days of advance warning before a bloom is expected. An Eddy inactive / Eddy active badge in the top-right corner gives at-a-glance status.
Station-specific default lag. Oguz et al. (2020) documented that the eddy-to-bloom lag in the western Black Sea lengthened from 10–14 days (2000–2010) to 14–21 days (2010–2020) as the pelagic ecosystem structure shifted. AQUA-SMART therefore uses a default lag of 17 days for Romania (midpoint of the 2010–2020 western-shelf range) and 13 days for Bulgaria and Georgia, where the western-shelf calibration does not apply. The default is overridden whenever the station has accumulated enough local eddy–bloom pairs to compute its own average.
Scientific basis: Oguz, T. & Gilbert, D. (2007). Abrupt transitions of the top-down controlled Black Sea pelagic ecosystem. Geophysical Research Letters 34, L10604. Oguz, T. et al. (2020). Turkish Journal of Fisheries and Aquatic Sciences 20:677–688.
Section 2c, Phytoplankton Community (NASA PACE)
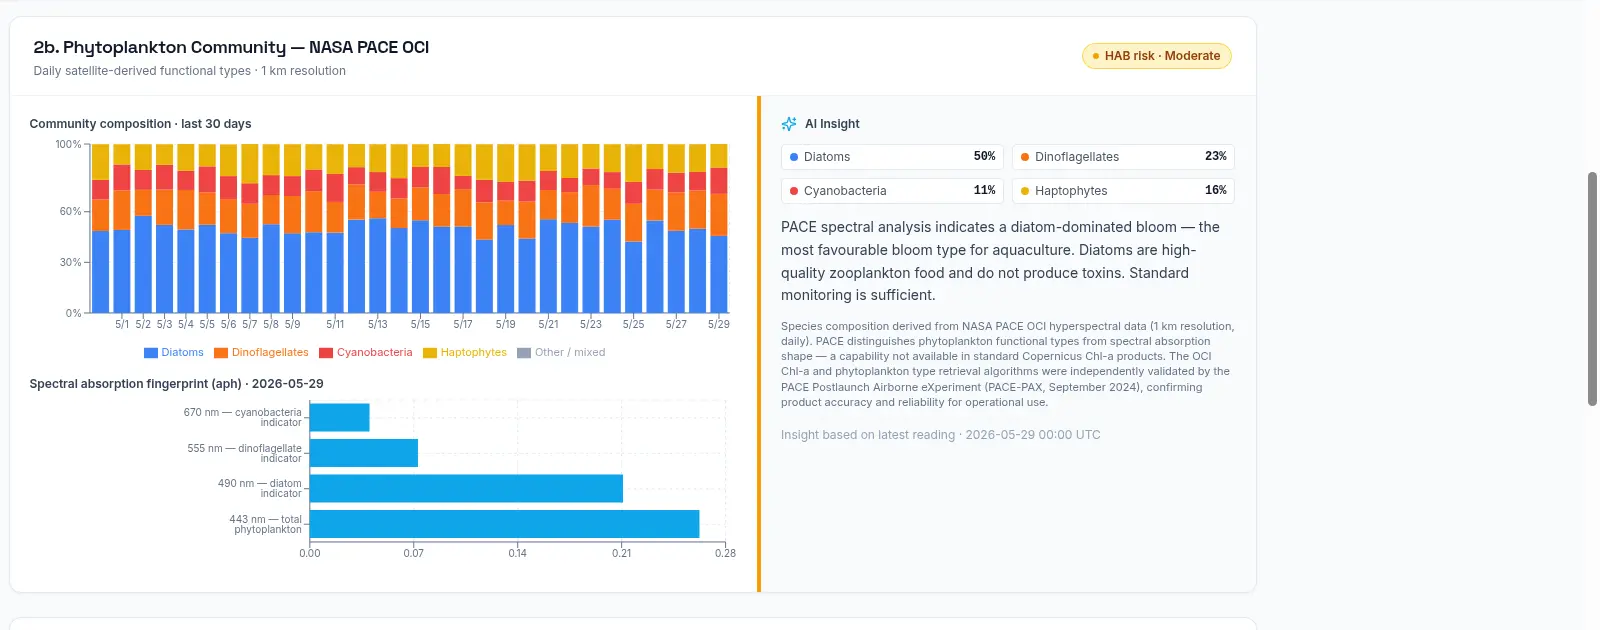
Daily percentage breakdown of phytoplankton functional types derived from PACE OCI hyperspectral data, plus a spectral absorption fingerprint for the most recent day. A HAB (Harmful Algal Bloom) risk badge is computed from the proportion of potentially toxic types (dinoflagellates + cyanobacteria):
| Risk | Threshold |
|---|---|
| Low | < 20% potentially toxic types |
| Moderate | 20–40% potentially toxic types |
| High | > 40% potentially toxic types |
The PACE-PAX validation citation is printed directly on this section: the OCI Chl-a and phytoplankton type retrieval algorithms were independently validated by the PACE Postlaunch Airborne eXperiment (September 2024), confirming product accuracy and reliability for operational use.
When today's PACE pass is not yet available (cloud cover, processing delay), an amber badge reads 'No satellite pass available, last data: [date]'. The composition chart continues to show the most recent valid day.
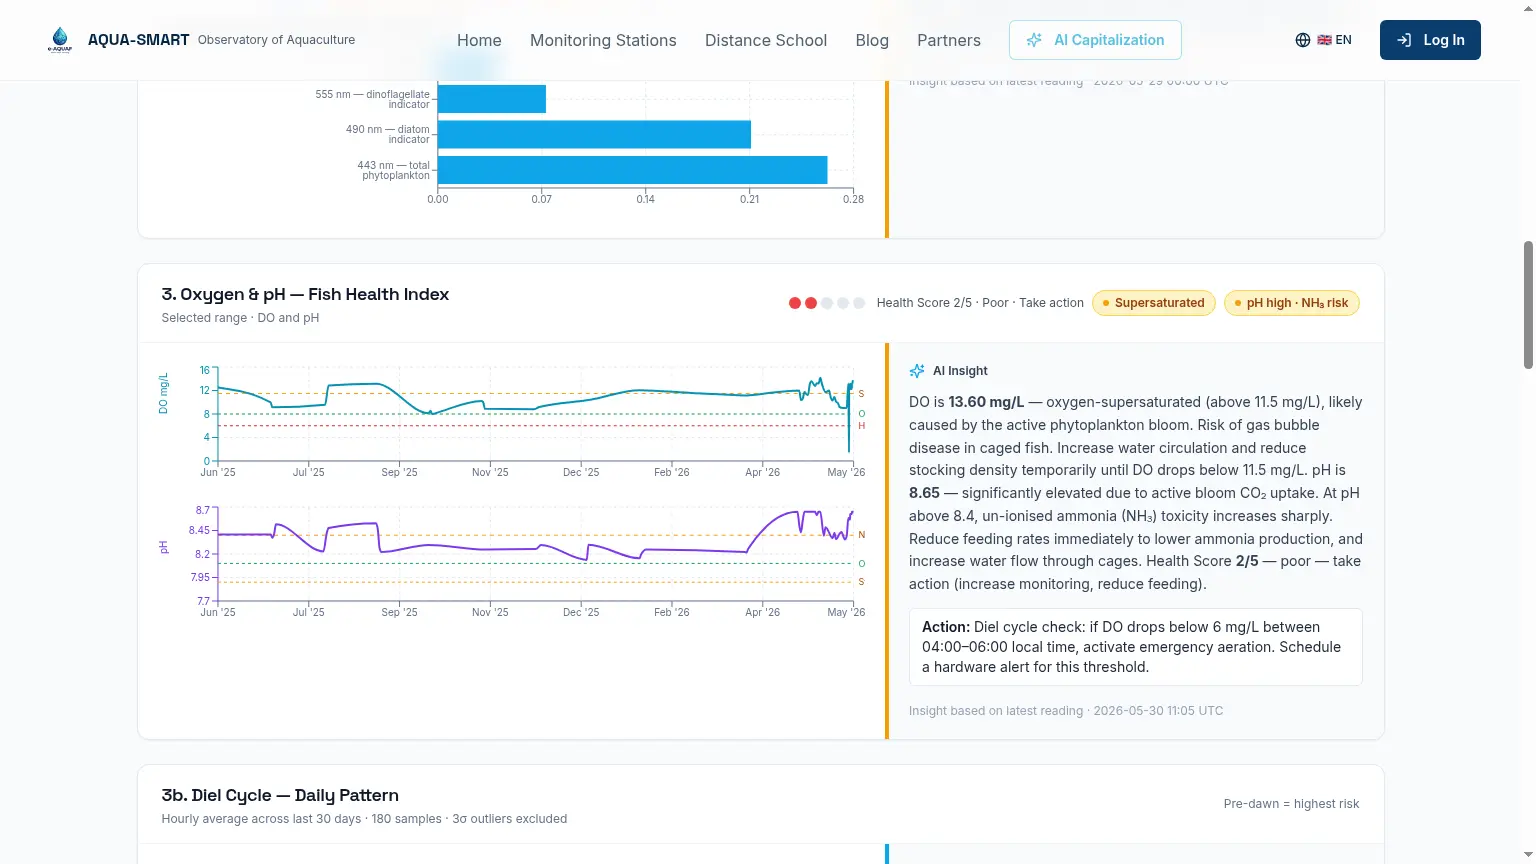
Section 3, Oxygen & pH, Fish Health Index
The two parameters most directly relevant to immediate farm management decisions.
| DO level | Meaning |
|---|---|
| Hypoxia | DO < 6.0 mg/L, emergency: stop feeding, activate aeration |
| Optimal | DO ≥ 8.0 mg/L, normal operations |
| Supersaturation | DO > 115% of temperature-corrected saturation*, gas bubble disease risk: reduce feeding |
*Supersaturation threshold is temperature- and salinity-corrected using the García & Gordon (1992) formula (DO_sat × 1.15). At 20°C Black Sea conditions, 115% saturation ≈ 10.1 mg/L; this value shifts with temperature.
CO₂ Elevation Proxy Badge (NEW). Whenever the Supersaturated badge is active, a paired amber badge "CO₂ elevation likely" now appears alongside it. No CO₂ sensor is required: during photosynthesis-driven oxygen supersaturation, dissolved CO₂ fluctuates inversely with O₂, and the same biological dynamics that drive DO > 115% also drive dangerous CO₂ swings that cause respiratory acidosis in caged fish. Operator action is to increase water flow through the cages. Sources: Hamre et al. (2020) Aquacultural Engineering 110:102296; Letelier-Gordo et al. (2020).
For pH, three reference lines are shown: Stress (7.9), Optimal (8.1), NH₃ Risk (8.4). Above pH 8.4, the proportion of toxic un-ionised ammonia (NH₃) increases sharply, making feeding-derived nitrogen dangerous for fish (Boyd & Tucker, 1998).
| Health Score | Meaning |
|---|---|
| 5/5 | Both DO and pH in optimal range |
| 4/5 | Minor deviation, monitor |
| 3/5 | Moderate stress, reduce feeding |
| 2/5 | Poor, take immediate action |
| 1/5 | Emergency |
Mortality Risk Banner, early WATCH state (NEW). The Mortality Risk Banner now includes a fourth level WATCH (pale yellow, no icon) between LOW and ELEVATED. It fires when DO is still above the 8.0 mg/L stress floor but trending down faster than −0.3 mg/L per hour and declining for 3 consecutive hours. Message: "Mortality risk WATCH, DO declining steadily. No action required yet. Monitor hourly." This gives operators a 2–6 hour head start before conditions reach ELEVATED, based on findings that DO trend rate predicts welfare stress before absolute thresholds are breached (Brijs et al., 2019 Aquaculture 507:385–394; Arechavala-Lopez et al., 2022 Reviews in Aquaculture 14(2):774–801).
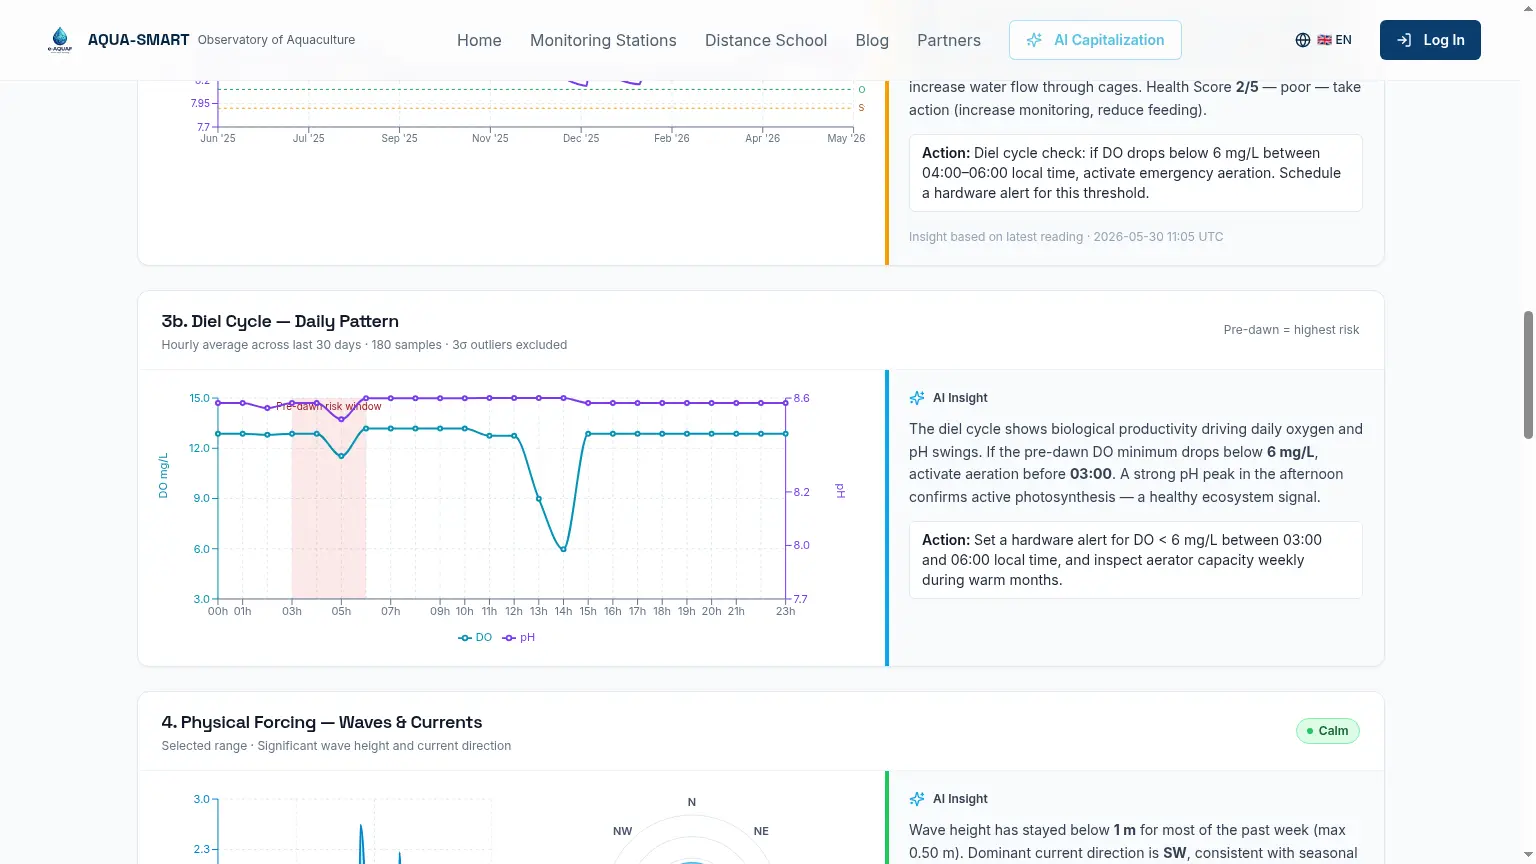
Section 3b (Diel Cycle) shows the average hourly DO and pH pattern over the last 30 days (3σ outlier exclusion). The pink pre-dawn risk window (03:00–06:00) marks the period when photosynthesis has stopped but respiration continues, the daily DO minimum. This is more useful for farm planning than a single instantaneous reading.
Section 4, Physical Forcing, Waves & Currents
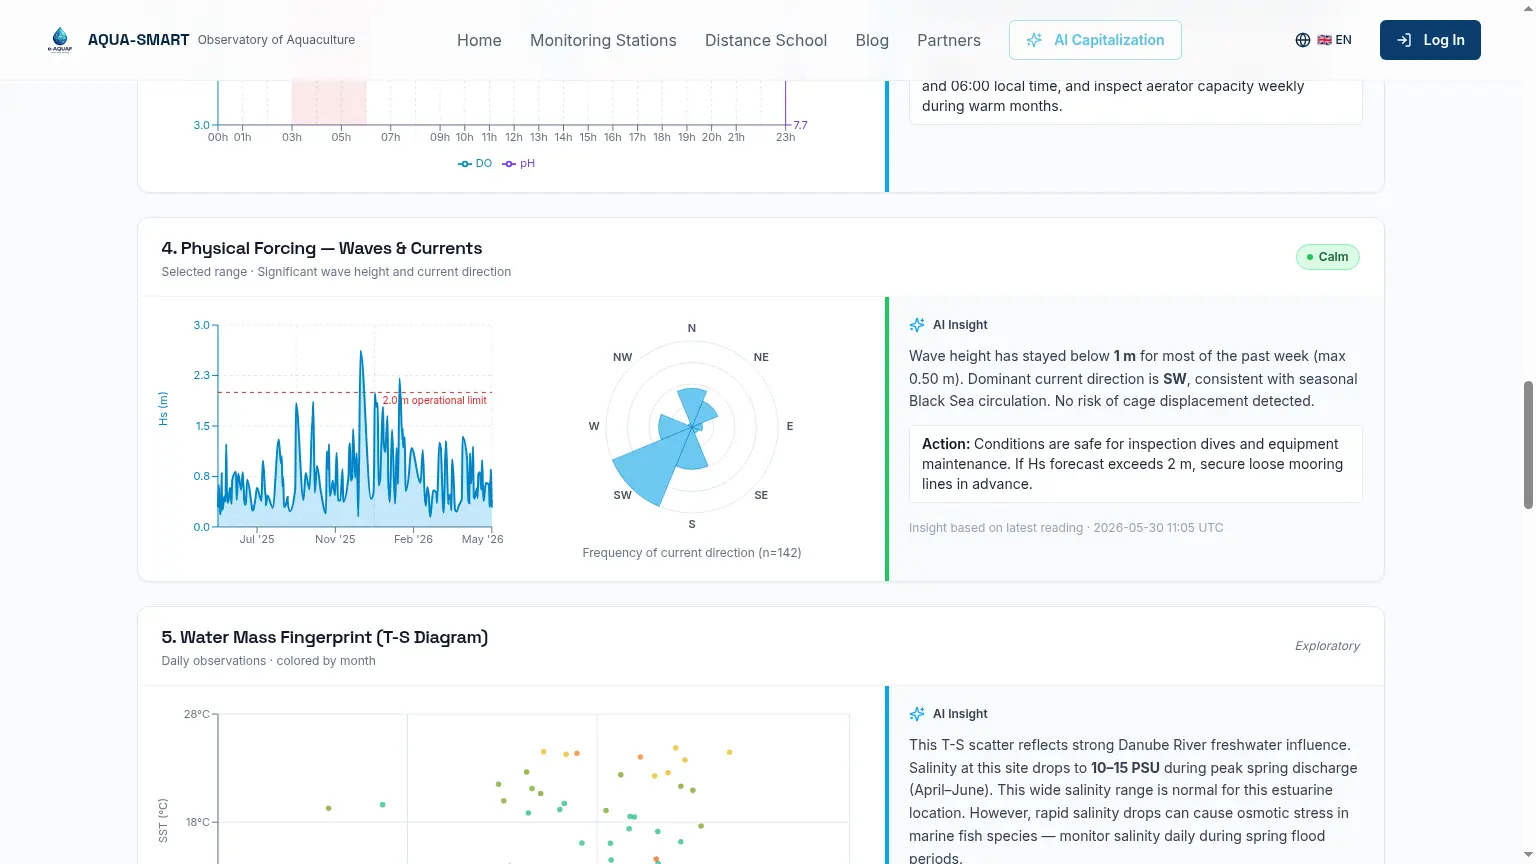
Significant wave height (Hs) and current direction determine cage structural safety and net water exchange. The operational limit line is set at Hs = 2.0 m, consistent with design standards for conventional floating net-pen systems (NS 9415:2009; Cardia & Lovatelli, 2007). Above this level, inspection dives and equipment maintenance should be suspended.
The current direction rose shows the frequency distribution of current direction over the selected period, helping identify dominant circulation patterns and plan optimal cage orientation.
Section 5, Water Mass Fingerprint (T-S Diagram)
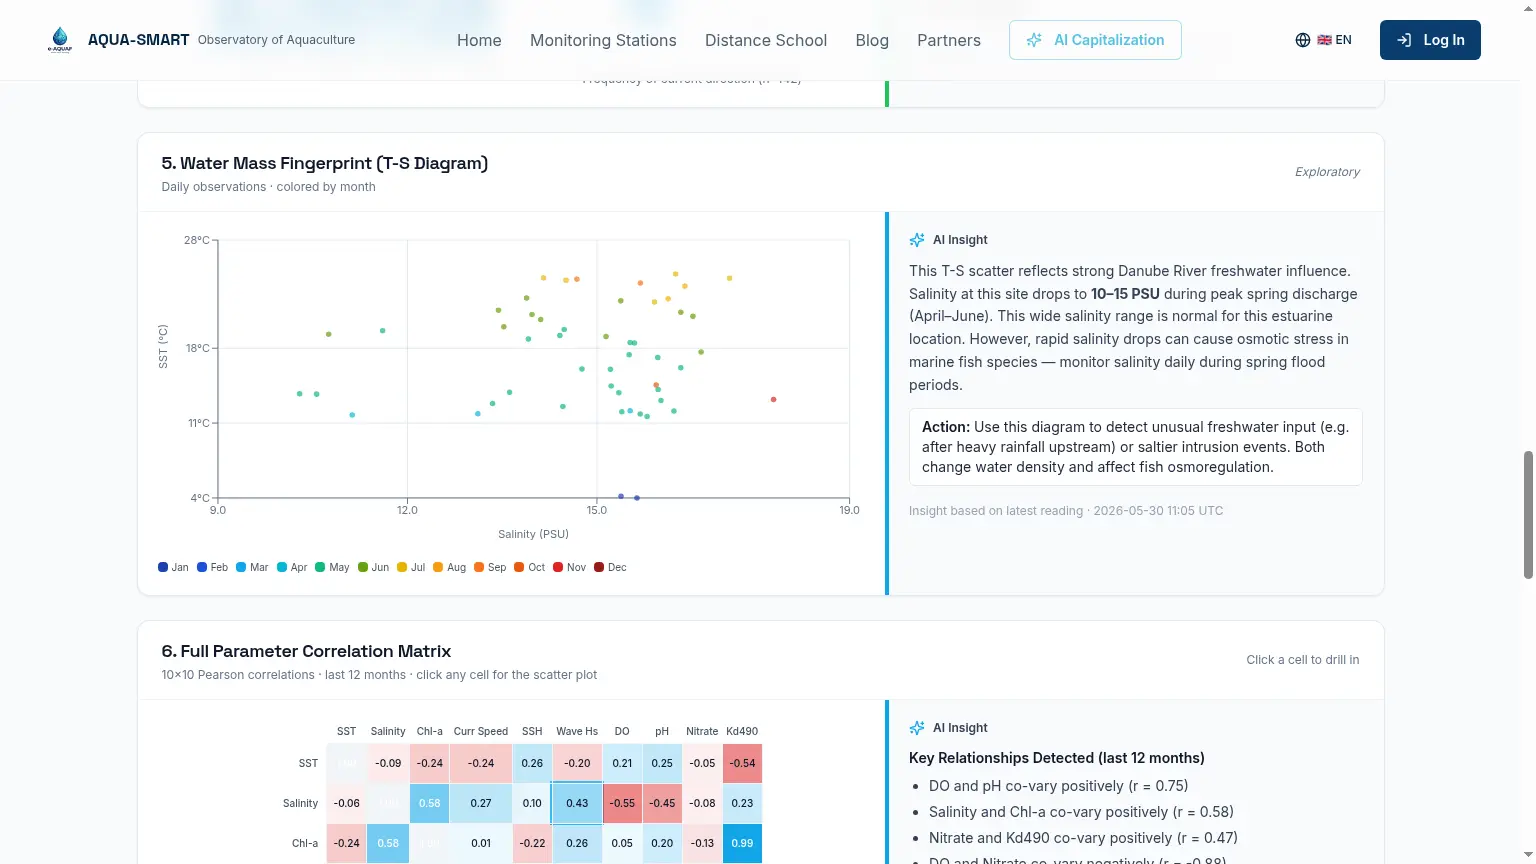
Every daily observation plotted as a point in temperature–salinity space, coloured by month. The Black Sea has a distinctive low-salinity signature (17–18.5 PSU vs 36–38 PSU Mediterranean). At Romania, data extends to very low salinities (10–15 PSU) in spring due to Danube discharge, osmotic stress territory for marine fish. A point far outside the seasonal cluster signals an unusual water mass.
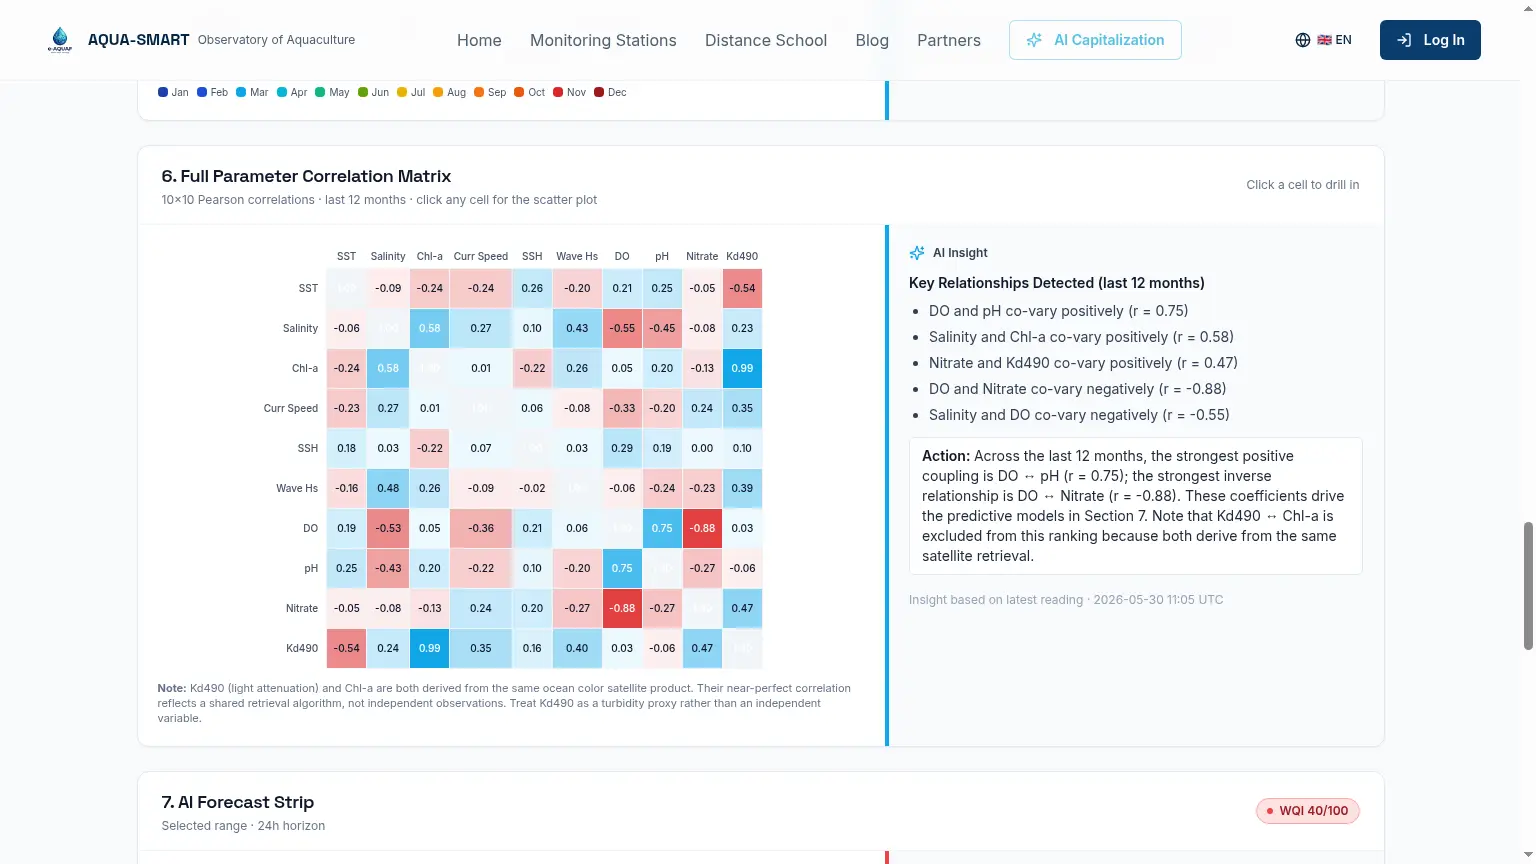
Section 6, Full Parameter Correlation Matrix
A 10×10 Pearson correlation matrix for all parameters over the selected time window. Click any cell to open a scatter plot. Most reliable at 30d or longer; a warning appears at 24h (<30 data points). Note: Kd490 and Chl-a always show near-perfect correlation because both derive from the same satellite retrieval algorithm, this reflects shared algorithm uncertainty, not an independent ecological relationship.
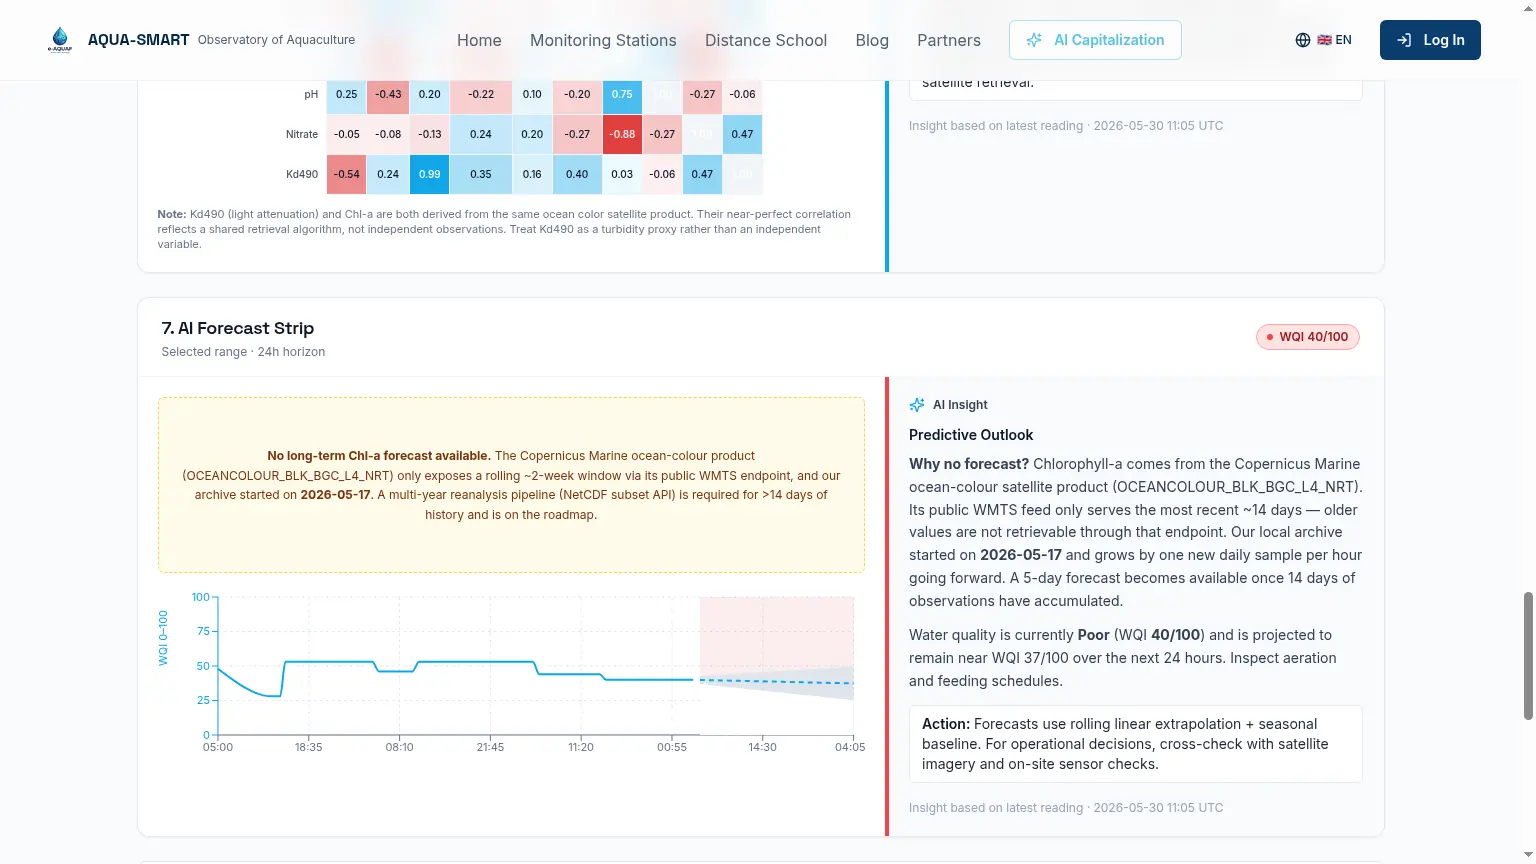
Section 7, AI Forecast Strip
The WQI forecast uses rolling linear extrapolation anchored to a seasonal baseline from the full observation history. It shows the projected WQI over the next 24 hours as a line chart with a confidence band.
WQI = 0.35 × DO_score + 0.25 × pH_score + 0.25 × SST_score + 0.15 × Salinity_score (Boyd et al., 1998, adapted for marine aquaculture).
The Copernicus Chl-a NRT product only serves a ~14-day rolling archive. A 5-day Chl-a forecast becomes available once 14 days of local archive have accumulated. The archive start date is shown in a yellow notice when this forecast is unavailable.
Harvest Timing Engine (NEW)
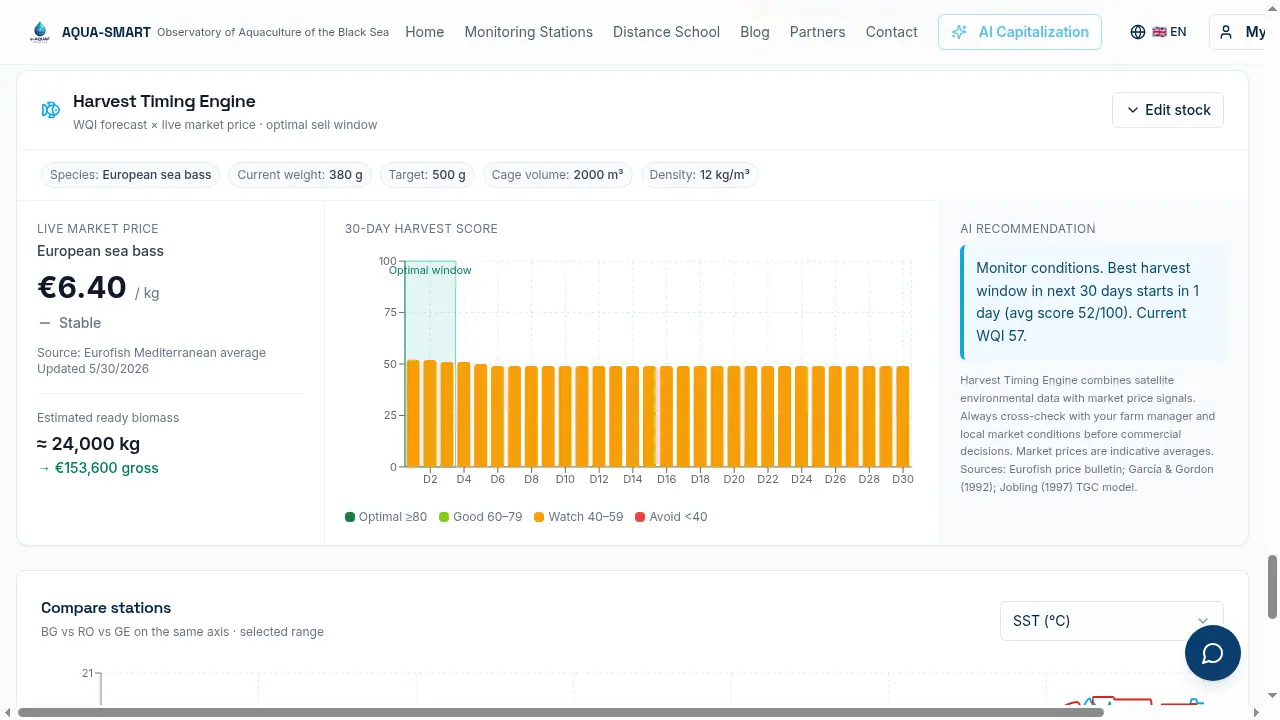
Placed directly after the AI Forecast Strip and before the Compare Stations panel, the Harvest Timing Engine is the most commercially actionable widget on the platform. It fuses the 14-day WQI forecast with live fish market prices to tell each operator the optimal window in which to harvest.
The widget has a small stock form (saved per browser via localStorage) where the operator enters their species, current average weight, target harvest weight, cage volume and stocking density. Once configured, the chips at the top of the card show the current setup at a glance.
Supported species: European seabass (Dicentrarchus labrax), Gilthead sea-bream (Sparus aurata), Atlantic salmon (Salmo salar), Rainbow trout (Oncorhynchus mykiss), Mediterranean mussel (Mytilus galloprovincialis), and bottom-grown mussel (Mytilus edulis). Growth constants, optimal temperature range and market price tables are species-specific.
Step 1, Live market price. The left panel shows the latest Eurofish Mediterranean / Black Sea bulletin price for the selected species, the trend (rising / stable / falling), and a derived Estimated ready biomass in kg and gross EUR value. Prices are stored in a dedicated database table and refreshed weekly.
Step 2, Growth projection. Daily weight gain over the next 30 days is projected using the Thermal Growth Coefficient model (Jobling, 1997, adapted), driven by the SST and DO forecast already shown in Section 7. A temperature factor (species-specific optimal SST) and an oxygen factor (penalised below 6 mg/L and above 11 mg/L) modulate the species' maximum daily gain.
Step 3, Harvest scoring. Each of the next 30 days receives a score 0–100:
Harvest score = 0.40 × WQI forecast + 0.35 × Market score + 0.25 × Growth efficiency
Market score compares today's price to the 6-month average and applies a +10 / 0 / −15 adjustment for rising / stable / falling trends. The centre panel renders the result as a 30-bar chart coloured dark green (≥ 80, optimal), lime (60–79), amber (40–59) and red (< 40). The highest-scoring consecutive 3-day window is highlighted with a teal Optimal Window bracket.
Step 4, AI recommendation. The right panel auto-generates one of four recommendations depending on conditions: harvest now (score ≥ 75 within 7 days), harvest before bloom (when a Bloom Watch is active), consider harvesting within 5 days (falling price + stable WQI), or hold harvest (WQI < 50, handling stress risk).
The Harvest Timing Engine combines satellite environmental data with market price signals. Always cross-check with your farm manager and local market conditions before commercial decisions. Market prices are indicative averages. Sources: Eurofish price bulletin; FAO GLOBEFISH (automated monthly ingestion via AI summarisation); FAO FishStat (automated quarterly ingestion); García & Gordon (1992); Jobling, M. (1997). Temperature and growth: modulation of growth rate via temperature change, in Global Warming: Implications for Freshwater and Marine Fish, Cambridge University Press.
Market Demand Signal (NEW)
The Harvest Timing Engine now also pulls regional production and price baselines from FAO FishStat and FAOSTAT. For the selected species, the widget computes:
- Regional market share, a donut chart of basin-country production for the relevant ISSCAAP species group (e.g. Miscellaneous coastal fishes for sea-bass / sea-bream).
- 5-year FAO producer-price baseline, a colour-coded Price Signal pill (above / at / below 5-year FAO average) sitting next to the live Eurofish price.
- Production trend, strong growth, steady, declining, classified from the slope of the last 5 years of FAO production data for the operator's country.
These three signals are folded into the AI recommendation so the engine considers not only farm-level water quality and current price, but also the medium-term market context for the species being grown.
A footnote below the regional share chart explicitly names which Black Sea basin countries have zero reported production for the selected species group (e.g. only Türkiye and Greece report sea-bass / sea-bream in any meaningful volume), so the chart is never silently incomplete.
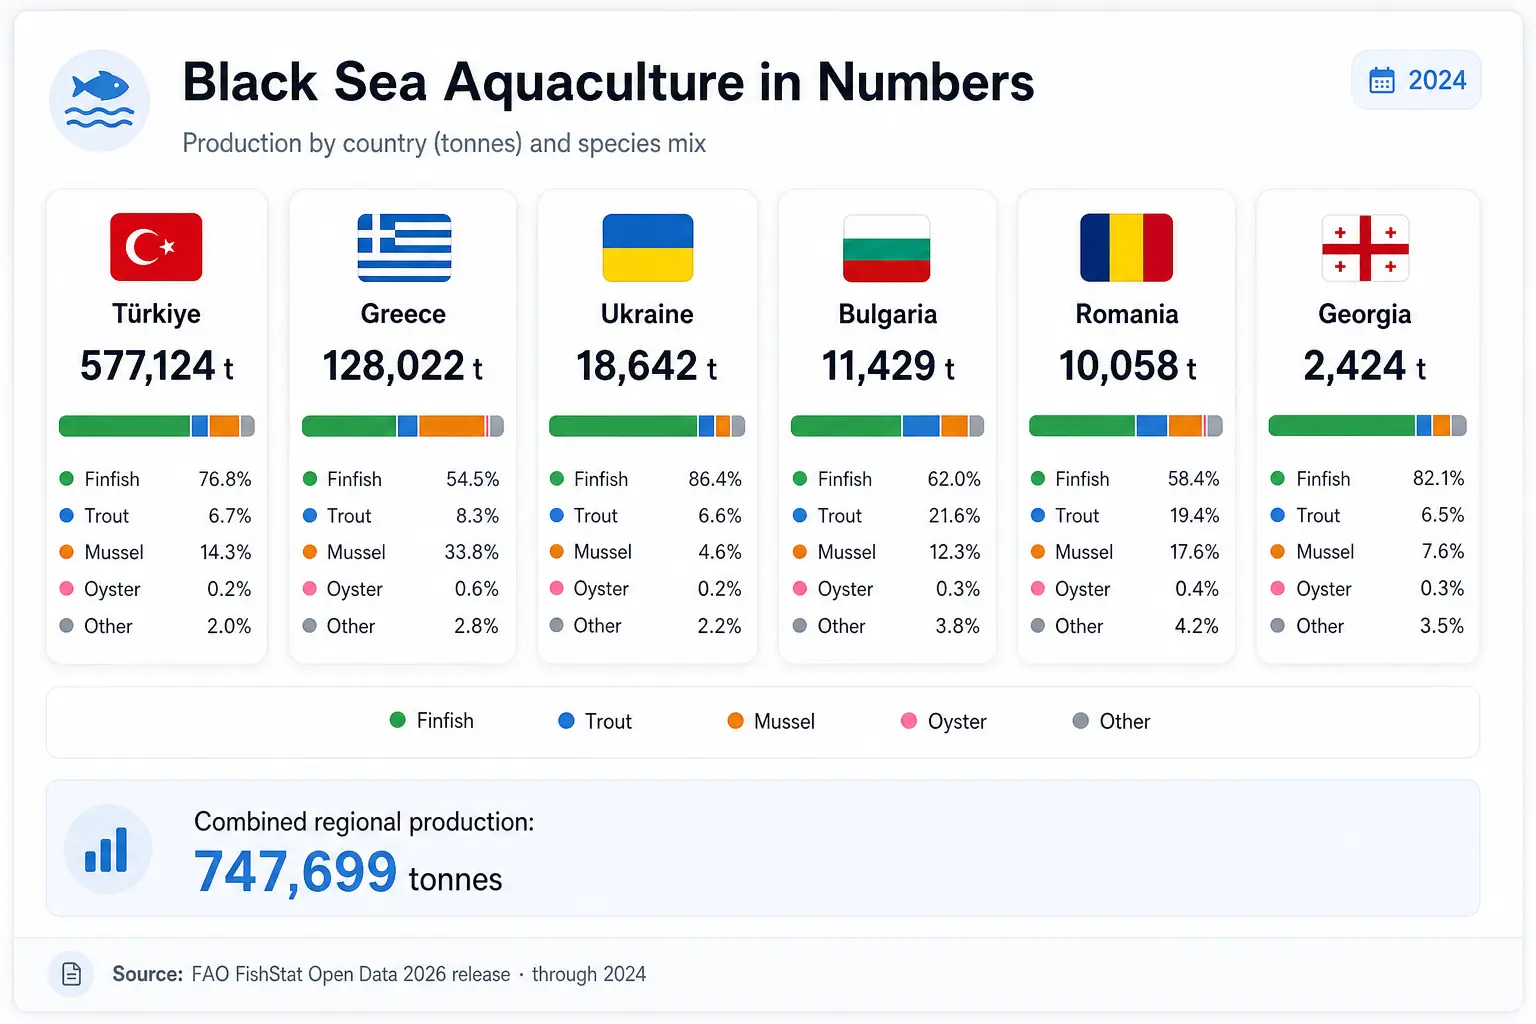
Black Sea Aquaculture in Numbers (NEW)
A FAO-powered context widget now lives on both the Homepage hero and the Partners / Consortium page. It surfaces the most recent FAO FishStat data for the Black Sea basin countries: Romania, Bulgaria, Türkiye, Georgia, Moldova, Armenia, Greece and Ukraine.
The widget shows:
- Combined regional production for the most recent reporting year (2024): 747,699 tonnes
- Per-country card for each producing country, ranked by tonnage, with rank position and percentage share of regional total
- Species mix bar for each country (Finfish / Trout / Mussel / Oyster / Other) derived from ISSCAAP groupings, shown as a colour-coded horizontal bar inside each card
- Click-to-expand detail dialog, tapping any country card opens a full breakdown: total production, species group percentages, a scrollable list of every FAO species item (e.g. European seabass, Mediterranean mussel, Rainbow trout) with exact tonnage, and the country's rank in the basin
- Source citation, FAO FishStat Open Data 2026 release, Global Aquaculture Production, through 2024
Data is refreshed every 4 months by a scheduled backend job and cached in a dedicated table to keep the page instant.
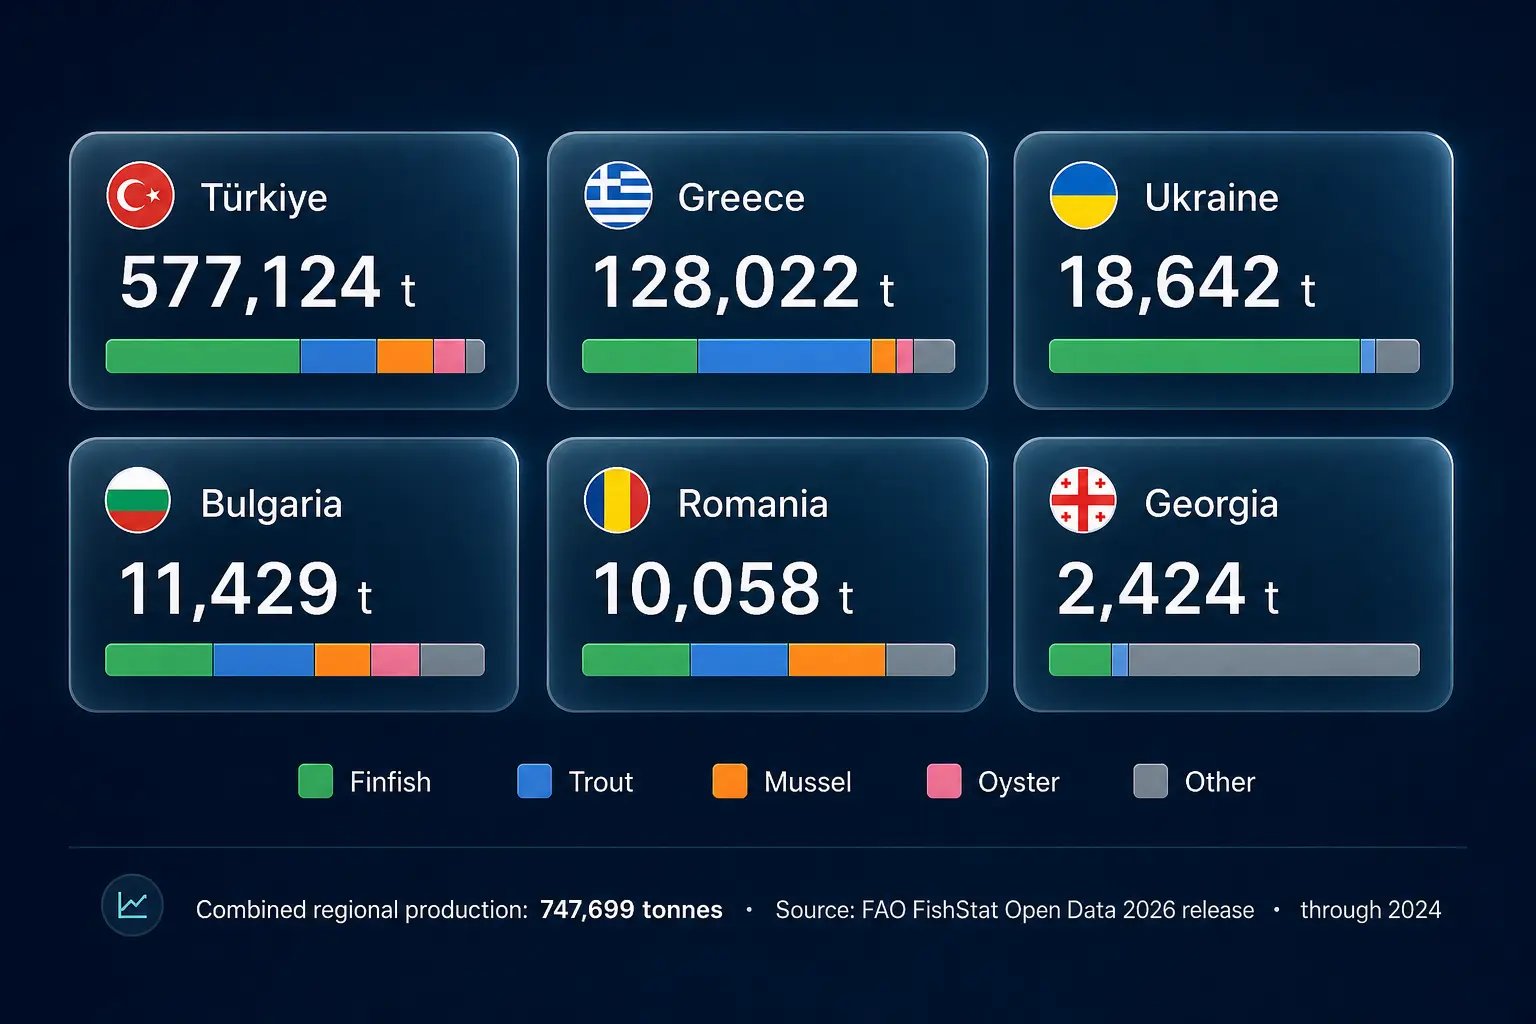
The same production numbers are also rendered in a larger format on the Partners / Consortium page:
AIS Vessel Traffic Overlay (NEW)
A new Vessels layer on the Atlas ingests live AIS (Automatic Identification System) positions from the global AISStream feed for the Black Sea bounding box. Every position update writes to a backend table and is rendered on the map as a directional vessel icon coloured by ship type, green for cargo, orange for fishing, red for tanker, blue for passenger, grey for other.
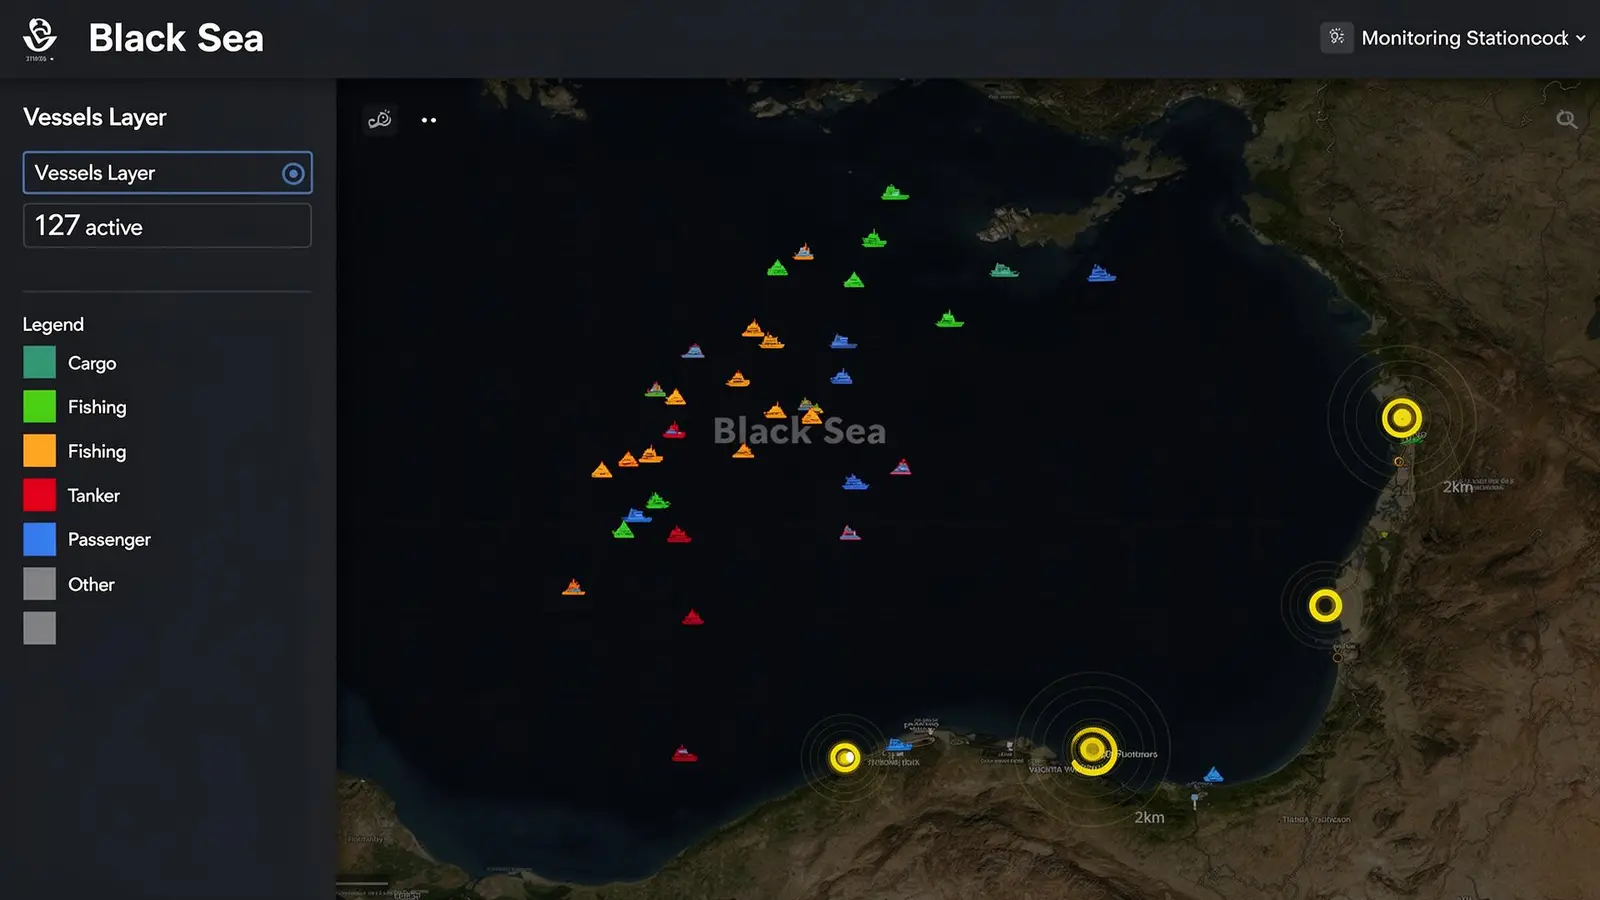
A server-side proximity check runs every five minutes:
- For every monitoring station, any vessel within a 2 km radius triggers a Vessel Proximity Alert
- Alerts are deduplicated for 24 hours per vessel + station pair to avoid alert fatigue
- The alert payload includes vessel MMSI, name, type, speed, course and closest approach distance
The overlay panel exposes the live active vessel count, a type legend, and a toggle to hide vessels when the map gets crowded. Because positions are persisted to the backend, the same data feeds historical traffic analysis, useful for correlating fishing pressure or shipping lane activity with water-quality anomalies recorded by nearby stations.
This is the first step toward biosecurity and anti-fouling situational awareness for cage farms, knowing when fishing or cargo traffic is operating immediately next to a sensitive site, and being able to reconstruct who was nearby when a bloom, oxygen drop, or pollution event occurred.
Station Registration, Join the Network (NEW)
Visitors who operate their own monitoring buoy or coastal sensor station can now submit it for integration directly from the website. Two entry points:
- The 'Have a station? Join the network' button at the top of the Monitoring Stations page
- The 'Register your station' link in the site footer
The dialog captures organisation, contact details, station GPS coordinates, parameters measured and transmission protocol. Submissions land in a dedicated backend table and notify the AQUA-SMART team for follow-up. There is no login requirement, the form is open to all coastal aquaculture operators across the eight basin countries.
Water Quality Certificate (NEW)
The Certificate button (next to CSV in the header) generates a one-page A4 landscape PDF documenting satellite-verified environmental conditions for the last 90 days. It is designed for:
- Regulatory submissions to national aquaculture authorities
- Premium product labelling, 'produced in waters independently verified by NASA and Copernicus satellite data'
- EU project reporting and Interreg deliverable evidence
The certificate shows average WQI, bloom-free days, DO-optimal days, data source verification table, and a QR code linking to the live station. Footer: 'Chlorophyll-a and phytoplankton composition independently validated by the PACE Postlaunch Airborne eXperiment (PACE-PAX, September 2024).'
Time Range Selector
All charts respond to the global time range selector: 24h, 7d, 30d, 90d, 1y, All, and Custom. The Copernicus NRT Chl-a archive is limited to approximately 14 days, for longer ranges the PACE historical backfill is used. The Correlation Matrix (Section 6) requires at least 30 data points and will show a warning at 24h.
The Atlas, Satellite Overlays and Site Suitability
The Atlas is a dedicated full-screen map page at www.eaquaf.eu/atlas. The Monitoring Stations page keeps a compact preview card that links to it. All layers are controlled from the Layers panel on the left, grouped into Water, Rules and People, and every choice is stored in the page address so any view can be shared as a link.
Satellite Overlay Panel
Switch between eleven live Copernicus Marine layers with the Variable selector inside the Layers panel: Sea Surface Temperature, Salinity, Chlorophyll-a, Currents (E/W), Currents (animated flow field), Sea Surface Height, Wave Height, Dissolved O₂, pH, Nitrate, and True Colour (when cloud-free). An "About this variable" link under the selector opens a popup explaining the variable, its scale and its data source, and a compact legend on the map always shows the active colour scale.
Bloom Layer Toggle
The Bloom control is a compact expandable box in the Layers panel with a three-way switch, Off / PACE / Copernicus, overlaying the selected chlorophyll-a product as a basin-wide colour grid with the same scale as the station chart: 0, 0.1, 0.5, 1, 3, 10+ µg/L. The PACE layer shows the most recent NRT pass date. A Black Sea Timelapse button under the Bloom box opens an animated playback of recent satellite passes.
Protected Areas and "Who governs this spot?" (NEW)
The Protected areas layer in the Rules group streams the official conservation maps as images directly from the publishing services, Natura 2000 (Habitats and Birds sites, EEA), the Emerald Network (Council of Europe) and the WDPA (UNEP-WCMC / IUCN via Protected Planet), with the official attribution shown on the map. No protected-area shapes are ever downloaded or stored by AQUA-SMART.
Clicking anywhere on the sea opens a "Who governs this spot?" panel listing every protected area that covers the point, grouped by source, with the managing authority and a link to the official record. Natura 2000 sites carry the Article 6(3) appropriate-assessment note. Clicks far from any area report the nearest one instead.
Stakeholders, Partners and Relationships (NEW)
The People group maps the organisations from the AQUA-SMART directory by city: country bubbles when zoomed out, small category-coloured dots for single-organisation places and merged count clusters at mid zoom, and individual pins up close. The panel includes search, category filters with Select all / Deselect all, a country filter and an "Active since 2016" switch. Contact details are never shown on the map. The e-AQUAF partners switch marks the six project partner cities with a diamond, and the Relationships layer draws curved lines between places whose organisations share past Black Sea Basin projects, click a place to see only its lines, or switch to All places for the full network; thicker lines mean more shared projects.
Anomaly Badges
Station markers show ▲ High or ▼ Low badges when SST or wave height deviates more than ±2σ from the station's own 7-day hourly baseline (Open-Meteo Marine data, minimum 12 hourly samples required). The badge shows the number of standard deviations from baseline.
Site Suitability Layer (NEW)
Toggle the Site Suitability layer from the LAYERS panel to see a colour-coded grid across the Black Sea basin. Every 0.1° cell (~10 km) receives a score 0–100 from a six-factor weighted composite:
| Factor | Weight | How computed |
|---|---|---|
| WQI | 0.26 | Mean daily Water Quality Index over 90 days |
| Depth | 0.25 | GEBCO bathymetry, optimal 20–80 m |
| Bloom frequency | 0.20 | % of days with Chl-a > species-specific threshold |
| Wave exposure | 0.10 | Mean Hs relative to species wave max |
| Current speed | 0.10 | Optimal 0.05–0.50 m/s; 0 score above current max |
| Oxygen stability | 0.09 | % stress days (DO < threshold or > 115% saturation) |
Sites shallower than 15 m are hard-excluded (hatched cells). Marine Protected Areas (WDPA database) receive a zone penalty of 0.00. A Target Species selector (defaulting to General Aquaculture) re-scores the entire map for Sea Bass, Sea Bream, Turbot, Sturgeon, Mussel or Oyster using species-specific SST, salinity, DO and bloom thresholds. An "About site suitability" link under the selector explains the scoring, and a "Methodology & References" link opens the full specification.
| Score | Label |
|---|---|
| 80–100 | Highly Suitable |
| 60–79 | Suitable |
| 40–59 | Moderate |
| 20–39 | Poor |
| 0–19 | Unsuitable |
| − | Excluded (depth < 15 m or MPA) |
Clicking any cell opens a compact panel showing the score, the suitability verdict, the confidence level and the cell details. Cells inside a protected area are marked as needing an assessment. The "Methodology & References" popup in the Layers panel opens the full specification with all 14 scientific references.
Compare Stations
At the bottom of every station page, all three stations are overlaid on the same axis for the selected metric and time range. Available metrics: SST (°C), Salinity (PSU), Chlorophyll-a (µg/L), DO (mg/L), pH, SSH (cm). The Chl-a view shows a 'Copernicus NRT · last ~14 days available' note.
Scientific References
All methodology, thresholds and scoring parameters are grounded in peer-reviewed literature and international standards:
Ocean colour and phytoplankton
- Stramski, D. et al. (2001). Relationships between the surface concentration of particulate organic carbon and optical properties. Progress in Oceanography 122:72–100.
- Ciotti, Á.M. & Bricaud, A. (2006). Retrievals of a size parameter for phytoplankton. Limnology & Oceanography: Methods 4:237–253.
Black Sea oceanography
- Oguz, T. & Gilbert, D. (2007). Abrupt transitions of the top-down controlled Black Sea pelagic ecosystem. Geophysical Research Letters 34, L10604.
- Black Sea Commission (2019). State of the Environment of the Black Sea (2009–2014/5). BSC, Istanbul.
Aquaculture water quality
- Boyd, C.E. & Tucker, C.S. (1998). Pond Aquaculture Water Quality Management. Kluwer Academic.
- Beveridge, M.C.M. (2004). Cage Aquaculture, 3rd edition. Blackwell Publishing.
- Boyd, C.E. (2015). Water Quality: An Introduction, 2nd ed. Springer.
Dissolved oxygen saturation
- García, H.E. & Gordon, L.I. (1992). Oxygen solubility in seawater. Limnology and Oceanography 37(6):1307–1312.
- Weitkamp, D.E. & Katz, M. (1980). A review of dissolved gas supersaturation literature. Transactions of the American Fisheries Society 109(6):659–702.
Site selection standards
- Cardia, F. & Lovatelli, A. (2007). Aquaculture site selection and site management. FAO Technical Paper No. 498. FAO, Rome.
- Kapetsky, J.M. & Aguilar-Manjarrez, J. (2007). A GIS approach to the assessment of offshore potential for aquaculture development. FAO Fisheries Circular No. 1046.
- Aguilar-Manjarrez, J. et al. (2017). Offshore mariculture: A sea of opportunity. FAO Technical Paper No. 601.
- Standards Norway (2009). NS 9415:2009, Marine fish farms: Requirements for site survey, risk analyses, design, dimensioning, production, installation and operation.
Harmful algal blooms
- Hallegraeff, G.M. (1993). A review of harmful algal blooms and their apparent global increase. Phycologia 32(2):79–99.
About the Project
AQUA-SMART is developed within e-AQUAF (BSB01009), Smart Aqua Farming, co-funded by the Interreg NEXT Black Sea Basin Programme of the European Union. The platform is open source and built by Re:Invent Education with contributions from all project partners across Romania, Bulgaria and Georgia.
The responsibility for the content of this material is that of the author(s). The content does not necessarily represent the official position of the European Union.

Interreg NEXT Black Sea Basin Programme — Co-funded by the European Union
Download the AQUA-SMART app